

Key findings
- Across Corporate Knights’ full coverage universe of ~2,400 global companies, sustainable revenue now represents more than a tenth (10.5%) of all revenue earned. On the revenue constant cohort of 1,611 companies used for trend analysis, the compound annual growth rate (CAGR) of sustainable revenue was almost 3× that of the rest of revenue over the past five years.
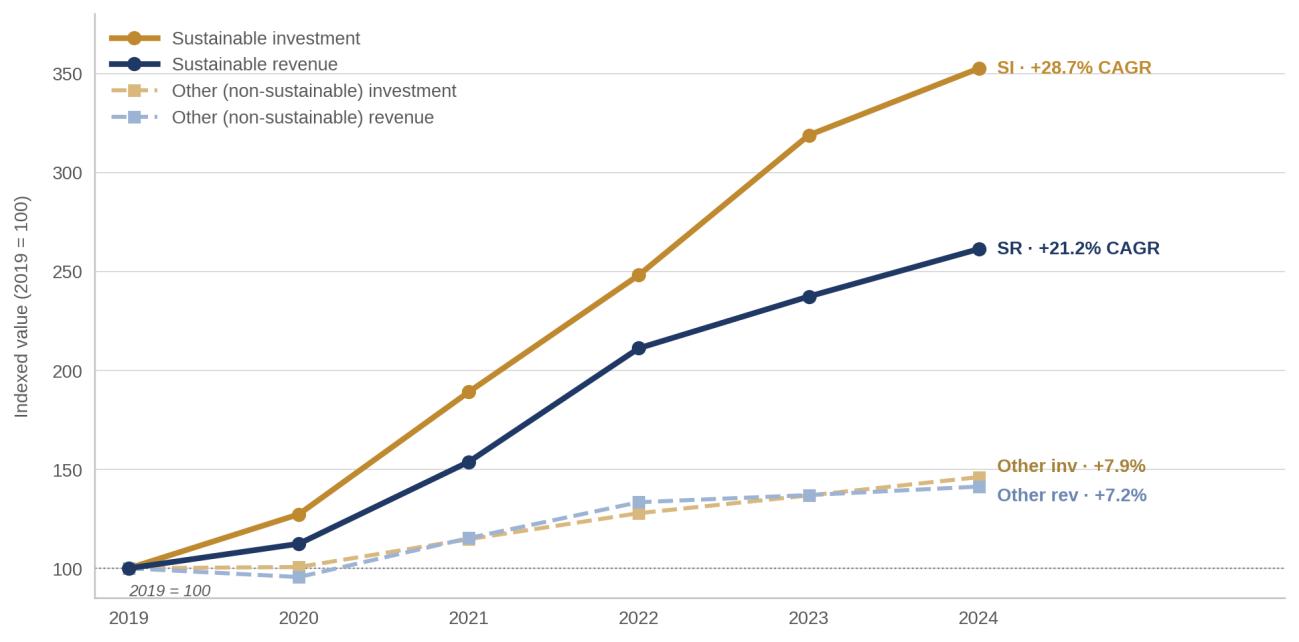
- For the constant cohort1, sustainable revenue grew at 21.2% CAGR over 2019–2024, vs. 7.2% for all other revenue — a +14.0 percentage point (pp) gap.
- Sustainable investment (SI) — comprising capital expenditure, research and development, and acquisitions — grew at 28.7% CAGR vs. 7.9% for all other investment — a +20.8 pp gap. SI rose from 6.3% to 14.0% of total investment.
- Asia-Pacific now leads on SI growth (33.2% CAGR), narrowly ahead of Europe (31.4%). Europe leads on share — SI is now 21.8% of regional capex.
- Clean product manufacturers — electric vehicles (EVs), batteries, electricals, heat pumps — are the standout: SI grew 47.5% annually, from $23B to $160B. Capex is moving where the physical transition has to happen.
Exhibit 1 · Year-by-year totals
USD PPP, $ billions
| Year | Total Revenue ($B) | Sustainable Revenue ($B) | SR % | Total Investment ($B) | Sustainable Investment ($B) | SI % |
|---|---|---|---|---|---|---|
| 2019 | 34,538 | 1,622 | 4.7% | 3,935 | 249 | 6.3% |
| 2020 | 33,282 | 1,823 | 5.5% | 4,027 | 317 | 7.9% |
| 2021 | 40,441 | 2,495 | 6.2% | 4,699 | 471 | 10.0% |
| 2022 | 47,335 | 3,426 | 7.2% | 5,331 | 618 | 11.6% |
| 2023 | 48,945 | 3,850 | 7.9% | 5,837 | 794 | 13.6% |
| 2024 | 50,747 | 4,239 | 8.4% | 6,262 | 878 | 14.0% |
| CAGR | 8.0% | 21.2% | — | 9.7% | 28.7% | — |
The Headline
Across the constant cohort, sustainable revenue grew roughly 2.9× faster than all other revenue over 2019–2024, and sustainable investment grew roughly 3.7× faster than all other investment. The gap is material and visible at the regional level.
Two numbers to remember
Sustainable revenue, 2019 → 2024
$1.6T → $4.2T
4.7% → 8.4% of total revenue
Sustainable investment, 2019 → 2024
$249B → $878B
6.3% → 14.0% of total investment
Sustainable investment consistently accounts for a larger share of total investment than sustainable revenue accounts for of total revenue — which is what we would expect if companies are building ahead of the demand curve.
Exhibit 2 · CAGR comparison, 2019–2024
| Metric | Sustainable CAGR | Other CAGR | Gap (pp) |
|---|---|---|---|
| Revenue 2019–2024 | 21.2% | 7.2% | +14.0 pp |
| Investment 2019–2024 | 28.7% | 7.9% | +20.8 pp |
Exhibit 3 · Indexed growth trajectory, 2019 = 100
Where the Growth Is — Sector
Every major emitting sector in the cohort is now investing in its sustainable line-item faster than in its legacy line-item. The biggest accelerators, by gap between SI and other-investment CAGR:
- Electrical equipment manufacturing — 59.9% vs. 4.7% (+55.2 pp). The grid build-out: transformers, switchgear, cabling. Already 22.6% of sector capex.
- Cars, trucks and parts — 55.2% vs. 10.3% (+44.9 pp). The global EV capex build-out. 2024 SI = $107B.
- Battery manufacturing — 54.2% vs. 15.9% (+38.3 pp), with 83% of sector capex already classified as sustainable. The cleanest pure play in the data.
- Semiconductor and electronic components (supply chain to EVs, solar, grid equipment) — 50.4% vs. 9.8% (+40.5 pp).
- Power Generation — 20.2% vs. 5.3% (+14.9 pp). The largest single pool of SI in the cohort at $293B in 2024 (49% of sector investment). Slower CAGR reflects a larger starting base.
Two sectors worth flagging for the opposite reason. Oil and gas upstream sits at $294B of capex in 2024 with 0.3% classified as sustainable — the majors’ drilling budgets remain effectively untouched by the transition. IT services companies invest heavily in data centre infrastructure and many earn sustainable revenue credit for cloud services that meet both energy efficiency thresholds and renewable energy requirements. However, their capital expenditure disclosures rarely break out the energy efficiency specifications or confirm renewable energy sourcing at the individual facility level, so only a small fraction of their massive investment base can be classified as sustainable under the Corporate Knights Sustainable Economy Taxonomy (CKSET).
Where the Growth Is — Region
Exhibit 4 · Revenue and investment CAGR by region
| Region | # Cos | SR CAGR | Rev gap (pp) | SI CAGR | Inv gap (pp) | SI % inv 2024 |
|---|---|---|---|---|---|---|
| Europe | 286 | 22.6% | +17.6 | 31.4% | +25.2 | 21.8% |
| North America | 563 | 19.2% | +11.8 | 27.0% | +18.1 | 9.9% |
| Asia-Pacific | 527 | 24.3% | +15.8 | 33.2% | +24.4 | 12.3% |
| Latin America | 50 | 12.8% | +7.3 | 16.2% | +15.2 | 16.0% |
| Middle East and Africa (MEA) | 38 | 25.6% | +16.9 | 10.7% | +4.5 | 15.5% |
| Global | 1,474 | 21.2% | +14.0 | 28.7% | +20.8 | 14.0% |
Asia-Pacific now leads on investment growth (SI CAGR 33.2%, narrowly ahead of Europe’s 31.4%) and has the fastest sustainable revenue growth at 24.3% — driven by Chinese and Korean EV, battery and solar manufacturers plus Japanese electricals. Regional sustainable revenue share is still the lowest at 6.6%, but the momentum is unmistakable.
Europe leads on share. SI is now 21.8% of European investment — more than double the North American rate — and the gap between SI and other-investment CAGR is 25.2 pp. European utilities, auto original equipment manufacturers (OEMs) and industrial majors are pivoting capex faster than their global peers.
North America has the lowest sustainable investment share of any region at 9.9% — half the European rate — likely reflecting the scale of conventional and technology infrastructure investment in the US, which dwarfs sustainable capex in absolute terms. The growth rate is respectable (SI CAGR 27.3%) but both Europe and Asia-Pacific are pulling away on share.
Middle East and Africa (MEA) tells a more nuanced story: sustainable revenue CAGR of 25.6% — faster than North America — driven by Turkish industrials and Gulf utilities pivoting toward clean energy. But total SI is modest and the investment gap of +4.5 pp is the smallest of any region, reflecting the continued dominance of oil and gas capex.
SI Through the Capex-Materiality Lens
Applying the Corporate Knights Capex Materiality Typology to the investment cohort filters for industries where capital expenditure is a meaningful indicator of sustainability direction. The typology assigns each Corporate Knights Peer Group (CKPG) to one of six buckets based on how a company’s capital expenditure functions in the transition. Bucket assignments are grounded in systematic analysis of the Corporate Knights Sustainable Economy Intelligence (SEI) universe (~2,400 companies, 64 CKPGs) and validated by lagged Spearman rank correlation analysis correlating SI percentage in year T with sustainable revenue (SR) percentage in year T+N, across a 2019–2024 panel of 1,474 companies. For CKPGs containing companies with structurally different profiles — including Electrical equipment, Semiconductors, Refining, Glass, and Waste Management — classification was performed at the company level using dominant CKSET Tier 2 activity codes.
Exhibit 5 · Sustainable investment by capex-materiality bucket
| Bucket | Name | Cos | 2019 SI ($B) | 2024 SI ($B) | SI CAGR | Share 2024 |
|---|---|---|---|---|---|---|
| B1 | Clean Energy Infrastructure | 151 | $151B | $413B | 22.3% | 47.1% |
| B2 | Clean Product Manufacturing | 217 | $23B | $160B | 47.5% | 18.2% |
| B3 | Industrial Process Decarbonization | 198 | $9B | $58B | 45.0% | 6.6% |
| B4 | Low-Carbon Service Operations | 162 | $14B | $39B | 23.3% | 4.4% |
| B5 | Critical Minerals & Materials | 104 | $9B | $24B | 22.3% | 2.8% |
| B6 | Energy Efficiency Products | 102 | $8B | $52B | 45.7% | 5.9% |
| OOU | Out of Universe | 540 | $36B | $131B | N/A | 14.9% |
The in-universe view (B1–B6) covers 934 companies and 85% of all sustainable investment, growing at 28.5% CAGR from $213B in 2019 to $747B in 2024. B2 (Clean Product Manufacturing) and B3 (Industrial Process Decarbonization) are the standout accelerators — both growing at 45% or more annually. B2 produces the equipment that reduces emissions in use; B3 shows the hard-to-abate sectors finally moving. B1 (Clean Energy Infrastructure) remains the largest pool at $413B — more than half of all in-universe SI.
B6 (Energy Efficiency Products) at $52B is larger than it appears in some analyses because it includes Taiwan Semiconductor Manufacturing Company (TSMC) and other major semiconductor manufacturers whose chips qualify under CKSET’s energy-efficiency thresholds. For this bucket, sustainable revenue is a more reliable signal than SI. B4 (Low-Carbon Service Operations) at $39B and B5 (Critical Minerals) at $24B are the two buckets with the largest growth runway relative to their current sustainable fraction of total capex.
About the CK Sustainable Economy Intelligence (SEI) Database
The Corporate Knights Sustainable Economy Intelligence (SEI) database tracks sustainable revenue, capital expenditure, research and development (R&D) and acquisitions across ~2,400 public companies representing ~80% of the global market capitalization. SEI defines ‘sustainable’ at the product and service level — not the company level — providing a granular view of which companies are genuinely shifting revenue and capital into the sustainability transition, at what pace. The database powers the Global 100, Best 50 and Clean 200 rankings and is used by the ClimateArc platform and institutional investors representing over $14 trillion in assets.
About the CK Sustainable Economy Taxonomy (CKSET)
About the CK Sustainable Economy Taxonomy (CKSET)
The Corporate Knights Sustainable Economy Taxonomy (CKSET) is a science-based, independently verified classification standard for sustainable economic activity, refined over a decade. It encodes analyst-validated activity definitions, proxy logic, eco-certification criteria, exclusion rules and weighting tables — and maps at ~95% concordance with the EU Taxonomy, while extending coverage to the all sectors of the global economy, well beyond the approximately one-third of EU economic activity currently in scope of the EU Taxonomy. CKSET is the classification backbone for every revenue, capital expenditure, R&D and acquisition figure in the SEI database.
To learn more about interesting sustainable trends from the Corporate Knights Database, please fill out our contact form or reach out to research@corporateknights.com.
